
EEG source localization
1. Physiology
Source of EEG
- The first a few pages of “François Grimbert, Olivier Faugeras. Analysis of Jansen’s model of a single cortical column. Research Report RR-5597, INRIA. 2006, pp.34.”
- From scholarpedia:
- Current consists of movement of positive and negative ions in opposite directions, but the total charge in any mesoscopic tissue volume is essentially zero.
- Height: 2-5 mm
- Diameter: 30 \(\mu m\) to 1 mm (But I think from other references, the diameter is ususally on the order of 100 \(\mu m\))
- From wikipedia: Various estimates suggest there are 50 to 100 cortical minicolumns in a hypercolumn, each comprising around 80 neurons. Their role is best understood as ‘functional units of information processing.
EEG bands (Copy from ref)
- Delta (1 to 4 Hz): It tends to be the highest in amplitude and the slowest waves. It is normal as the dominant rhythm in infants up to one year and in stages 3 and 4 of sleep.
- Theta (4 to 8 Hz): It is perfectly normal in children up to 13 years and in sleep but abnormal in awake adults.
- Alpha (8 to 13 Hz): Is usually best seen in the posterior regions of the head on each side, being higher in amplitude on the dominant side. It appears when closing the eyes and relaxing, and disappears when opening the eyes or alerting by any mechanism (thinking, calculating). It is the major rhythm seen in normal relaxed adults. It is present during most of life especially after the thirteenth year.
- Beta (greater than 13 Hz): It is usually seen on both sides in symmetrical distribution and is most evident frontally. It may be absent or reduced in areas of cortical damage. It is generally regarded as a normal rhythm. It is the dominant rhythm in patients who are alert or anxious or have their eyes open.
- Very high frequencies (typically 30 to 40 Hz) are referred to as gamma activity.
2. Imaging technique (most materials come from wikipedia)
Functional imaging technique
Functional magnetic resonance imaging:
- fMRI measures brain activity by detecting changes associated with blood flow. When an area of the brain is in use, blood flow to that region also increases.
- The primary form of fMRI uses the blood-oxygen-level dependent (BOLD) contrast.
- The technique can localize activity to within millimeters but, using standard techniques, no better than within a window of a few seconds.
Functional near-infrared spec·tros·co·py
- fNIRS is a non-invasive imaging method involving the quantification of chromophore concentration resolved from the measurement of near infrared (NIR) light attenuation or temporal or phasic changes.
- NIR spectrum light takes advantage of the optical window in which skin, tissue, and bone are mostly transparent to NIR light in the spectrum of 700–900 nm, while hemoglobin (Hb) and deoxygenated-hemoglobin (deoxy-Hb) are stronger absorbers of light.
- fNIRS has several advantages in cost and portability over fMRI, but cannot be used to measure cortical activity more than 4 cm deep due to limitations in light emitter power and has more limited spatial resolution.
Positron-emission tomography
- The system detects pairs of gamma rays emitted indirectly by a positron-emitting radionuclide, most commonly fluorine-18, which is introduced into the body on a biologically active molecule called a radioactive tracer. Three-dimensional images of tracer concentration within the body are then constructed by computer analysis. In modern PET-CT scanners, three-dimensional imaging is often accomplished with the aid of a CT X-ray(that is combine with antomical imaging) scan performed on the patient during the same session, in the same machine.
- Brain positron emission tomography is a form of positron emission tomography (PET) that is used to measure brain metabolism and the distribution of exogenous radiolabeled chemical agents throughout the brain.
- Usually used for cancers/tumours (consumes glucose) and dementias (because PET is good for measure metabolism)
- 10s of seconds to minutes of temporal resolution; high cost; because the radioactivity decays rapidly, it is limited to monitoring short tasks.
Single-photon emission computed tomography
- The gamma-emitting tracer is to be taken up by brain tissue in a manner proportional to brain blood flow, in turn allowing cerebral blood flow to be assessed with the nuclear gamma camera.
Antomical imaging technique
Computed tomography scan
- Many X-ray(1 pm wave length) measurements taken from different angles to produce cross-sectional (tomographic) images (virtual “slices”) of specific areas of a scanned object, allowing the user to see inside the object without cutting.
- CT images of the head are used to investigate and diagnose brain injuries and other neurological conditions, as well as other conditions involving the skull or sinuses.
Magnetic resonance imaging
- Nice video on MRI (https://www.youtube.com/watch?v=djAxjtN_7VE)
- The person is positioned within an MRI scanner that forms a strong magnetic field around the area to be imaged. In most medical applications, protons (hydrogen atoms) in tissues containing water molecules create a signal that is processed to form an image of the body. The contrast between different tissues is determined by the rate at which excited atoms return to the equilibrium state.
- The contrast provided between grey and white matter makes MRI the best choice for many conditions.
Ultrasound
- Ultrasound refers to sound waves with frequencies which are higher than those audible to humans (>20,000 Hz). Ultrasonic images, also known as sonograms, are made by sending pulses of ultrasound into tissue using a probe. The ultrasound pulses echo off tissues with different reflection properties and are recorded and displayed as an image.
- It is most commonly performed on infants, whose skulls have not completely formed.
3. Forward model
My notes from dipole modeling to BEM calculation.
Quasi-static Maxwell equation
- Haus, Hermann A., and James R. Melcher. “Electromagnetic Fields and Energy - Chapter 3: Introduction to Electroquasistatics and Magnetoquasistatics.” Electromagnetic Fields and Energy, 2008, http://ocw.mit.edu/.
- Malmivuo, Jaakko, and Robert Plonsey. “Bioelectromagnetism.8.Source-Field Models.” Bioelectromagnetism, Oxford University Press, 1995, pp. 148–58.
How to calcualte B.E.M model
- Must read reference: STATISTICAL PARAMETRIC MAPPING: THE ANALYSIS OF FUNCTIONAL BRAIN IMAGES, Chapter 28
- Popular reference:
- Mosher, John C., Richard M. Leahy, and Paul S. Lewis. “EEG and MEG: forward solutions for inverse methods.” IEEE Transactions on Biomedical Engineering 46.3 (1999): 245-259.
- He, Bin, et al. “Electric dipole tracing in the brain by means of the boundary element method and its accuracy.” IEEE Transactions on Biomedical Engineering 6 (1987): 406-414.
4. Inverse method:
Notations:
- \(L_s\): leadfield matrix for the sth dipole
- \(\hat{j}\): the reconstruction
- \(W\): the inverse operator or the weighting matrix, depend on the definition under different methods.
Spatial scanning
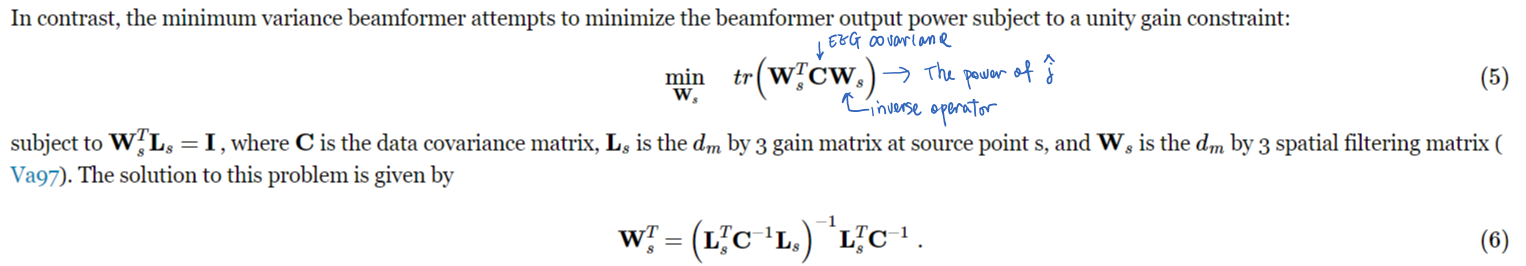
- Beamformer: Output power of the reconstruction at each voxel is minimized.
- Match filter
Distributed model
- LORETA:
- exact, zero error localization: In “R.D. Pascual-Marqui: Discrete, 3D distributed, linear imaging methods of electric neuronal activity. Part 1: exact, zero error localization. arXiv:0710.3341 [math-ph], 2007-October-17, http://arxiv.org/pdf/0710.3341”, it proved that the derivative of \(\hat{js}\) w.r.t. \(Ls\) is zero, if the reconstruction follows the following equation:
sLORETA and eLORETA both belongs to this family.
- sLORETA: Constrain the covariance of the reconstruction matrix to be identity matrix./ Reweight the result that the resolution matrix is identity.
- eLORETA: Assume the covariance of the reconstruction is a matrix \(W\) (similar to weighted minimum norm). And find \(W\) through an optimization technique such that \(W\) and \(T\) satisify the zero-error-family equation.